A token appearing in a trending list can feel like a signal worth acting on. Prices move fast, volumes spike, and the fear of missing out can push traders into decisions they later regret. That pattern plays out across crypto markets regularly, and Solana is no exception.
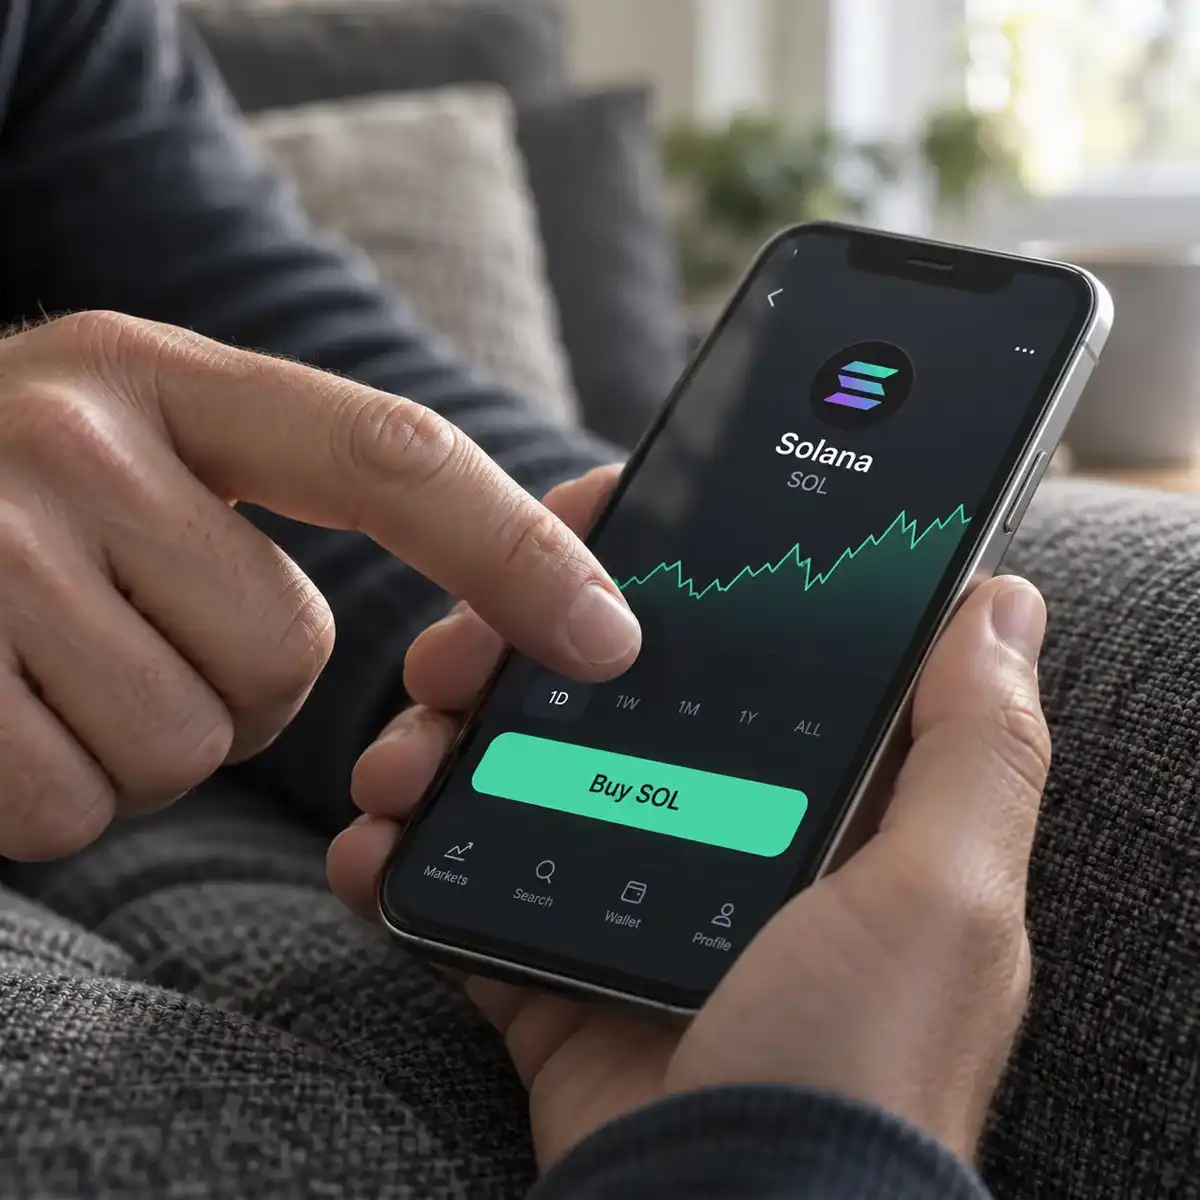
Trending Solana tokens attract attention for good reason. The network processes transactions quickly and at low cost, which makes it a natural home for active trading. But momentum alone does not tell you whether a token is worth buying. A sharp price move in the last 24 hours could reflect genuine demand, a coordinated pump, or simply thin liquidity responding to a handful of large orders.
Before putting money into any token that has caught your eye, there are several things worth checking first. Five practical checks can help you assess what sits behind the numbers. These checks will not remove all risk, but they give you a clearer picture of what you are actually buying into.
1. Real-Time Price and Volume Data
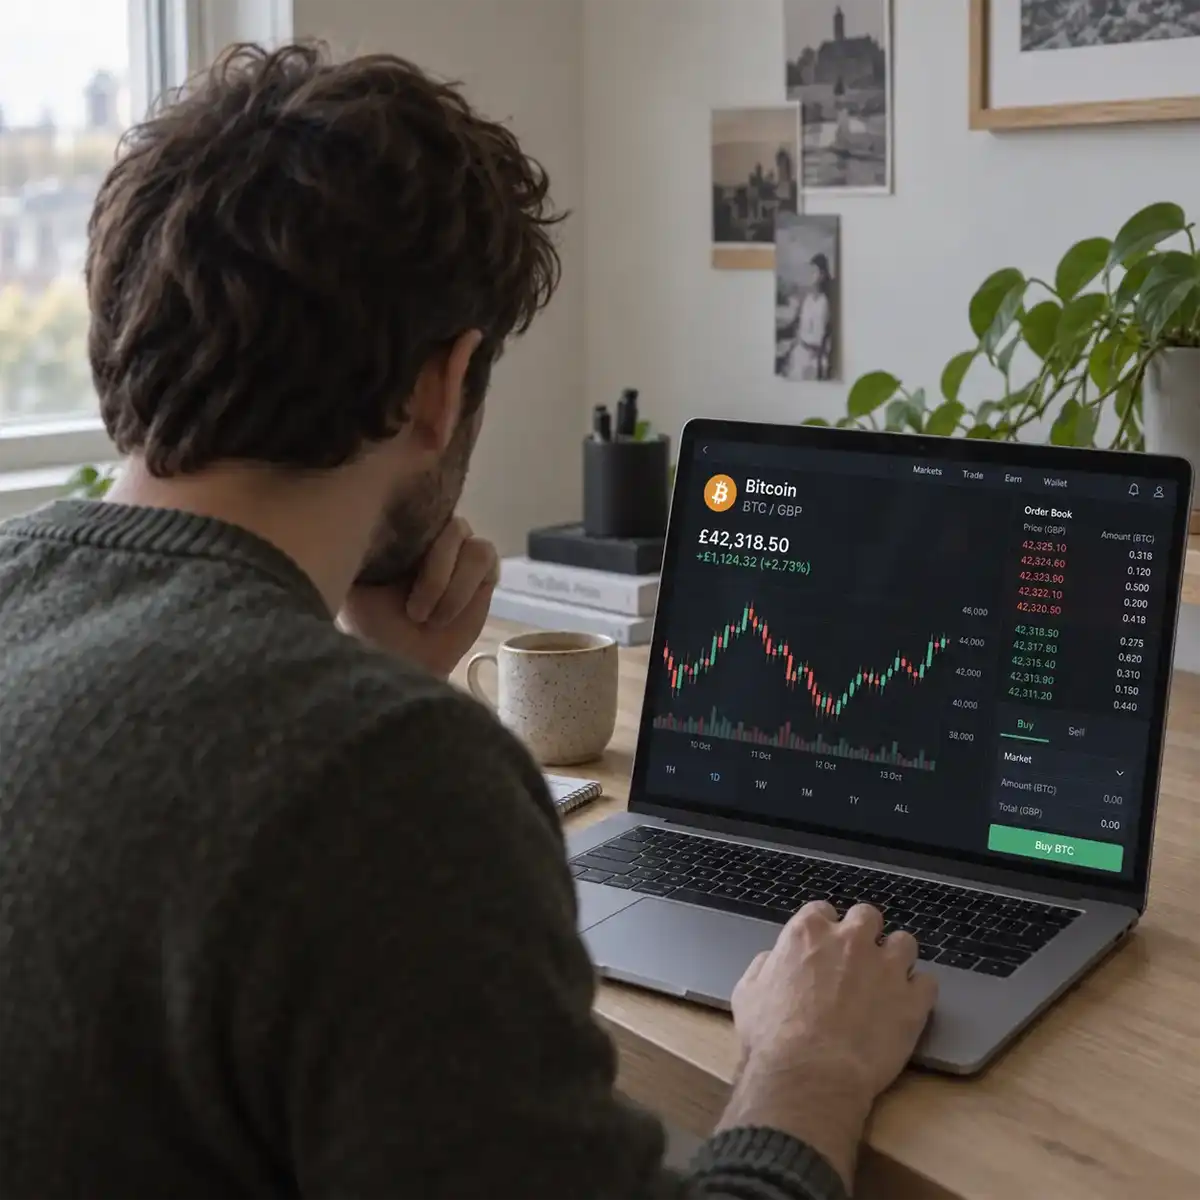
Live price feeds and 24-hour volume figures offer the first layer of context. Public platforms track token prices across exchanges and decentralised swaps. These feeds reveal whether a token receives steady trading or just a brief burst of interest.
Volume patterns matter because they show who is behind the moves. When most trades come from a single large order with no follow-up, the upswing may disappear quickly. If price jumps without matching buy or sell volume, that sends a warning.
The trending Solana tokens dashboard on Blockchain.ai streams volume and liquidity data with timestamps for every update. Traders can spot whether steady interest holds throughout the day or fades. For broader patterns, the official Solana data dashboard covers all network tokens and places trends next to market data.
Checking these numbers makes sense for unfamiliar or new tokens. Early market action often includes more noise. One limit of daily stats is that they do not predict whether high activity will continue.
Assessing Volume Surges
Trading that grows over several periods usually signals more than a brief buzz. A short spike often means temporary interest, not lasting demand.
Watching price and volume changes at the same time helps. If both rise and continue, broader demand is more likely. If the price moves but few trades happen, that may point to a single large buyer.
2. Liquidity Pool Depth and Slippage Risk
Pool depth is the amount of funds in the trading pool for a token. On decentralized exchanges, a deeper pool lets traders move larger sums without major price changes. This keeps trading conditions more stable.
Slippage is the gap between the listed price and the price actually paid for a trade. Smaller pools show more slippage. Even moderate trades can shift the market.
Solana liquidity signals show how much can move in or out before the price shifts. If pools are thin, even regular trades could trigger swings. The Solana data dashboard keeps pool sizes transparent and current.
Checking liquidity makes a difference especially for larger positions. Smaller pools can shift quickly when a token trends. A pool that looks deep can change just before the deal closes.
Spotting Slippage Triggers
Comparing the trade size with total liquidity reveals whether the trade might shift the market price. Large trades relative to the pool raise slippage risk.
Liquidity often changes as tokens trend. Pools can change with new buyers or when old holders leave. Checking the pool balance right before trading helps avoid last-minute issues.
3. Token Age and Contract Verification
Token age shows how long a token has traded publicly. It helps identify new launches and established coins. New launches offer little trading history and limited details about who buys and sells.
Contract verification adds reassurance. Verified contracts make code public so anyone can check whether the features match what was claimed. Seeing who deployed the contract and their background helps answer trust questions.
Sometimes, new tokens appear busy and seem to post strong numbers, yet they lack trading history. For these, it is essential to double-check both age and contract status before trusting big numbers or impressive volume.
Contract verification provides some safety, especially with tokens less than a month old. It does not guarantee total security. Even open, public code does not prevent issues like poor management or low usage.
Reviewing Launch Timelines and Source Code
Launch dates and code availability matter. Tokens created by new or unnamed teams come with more risk.
With newer tokens, audits, public team activity, and published whitepapers or documents can be helpful. If details are missing or unclear early on, there may be additional risk.
4. DEX Trading History and Wallet Concentration
DEX trading history shows whether trades keep happening or remain brief. This connects with wallet concentration. Few holders can create misleading signals. Wallet concentration reveals whether just a handful of investors hold most of a token's supply.
Distribution affects price stability. If a few wallets own most of the supply, the chance of sudden drops rises if one sells on a large scale. Sometimes, high volume emerges mainly from related wallets, not genuine public trading.
Public explorers let anyone view the largest holders. When just ten wallets control a large share of the supply, the risk of rapid price drops may be higher. Reviewing these numbers gives more context beyond trading data alone.
Scrutinising Holder Patterns
Large new wallets collecting major shares after launch deserve attention. Shifts in distribution may point to broad interest or a coordinated entry by a small group.
Tokens with smaller holders often avoid sharp price shocks. This leads to steadier movement. If only a few hold most of the supply, extra caution is wise.
5. Broader Market Context for the Token's Sector
Tokens all fit into categories, such as meme coins, real-world asset tokens, or DeFi projects. Checking overall Solana market data shows whether the entire sector is moving, or just a single token standing out. Comparing sector and token movement builds a clearer view of what drives specific price changes.
At times, a token rises with others from its group. Several DeFi tokens posting gains together points to wider sector activity. When only one token jumps and peers remain flat, news or updates about that project may explain it.
Comparing token action with sector trends shows whether momentum is part of a wave or the result of separate news. Tools like the Solana Ecosystem Roundup and official Solana update feeds provide additional background.
Comparing Sector and Token Performance
When looking at a token's performance, checking whether others in the group shift in similar ways helps. Solana dashboards summarise these trends.
Looking at the sector helps determine whether a token's move will continue or slow down. More information makes planning future trades or investments easier.
Putting the Checks Together
No single check works alone. Each adds more detail to the picture. A token might pass one test but fail another.
Tokens that trend demand quick responses. Reviewing price and volume, moving through liquidity, token details, and finishing with sector analysis gives a stronger chance at success. Real-time data and a sector-aware approach combine to support better decisions.